Performance & Report
How your site does in Google search: clicks, impressions, position and click rate, the trend, and a one-page report to share.
What it's for
Search traffic moves slowly and in waves, so a single day says little. This screen shows the period against the one before, the trend line with a short forecast, and the patterns worth knowing about, such as a week below average.
Before you start
- Your plan. Performance & Report is included in the Pro and Full plans.
- Google Search Console connected under Connectors, for your website. See Connections.
- For the business results (conversions, sessions), Google Analytics too.
How to read it
- In the sidebar, choose Organic Visibility → Performance & Report.
- Pick the period at the top right, for example Last 28 days.
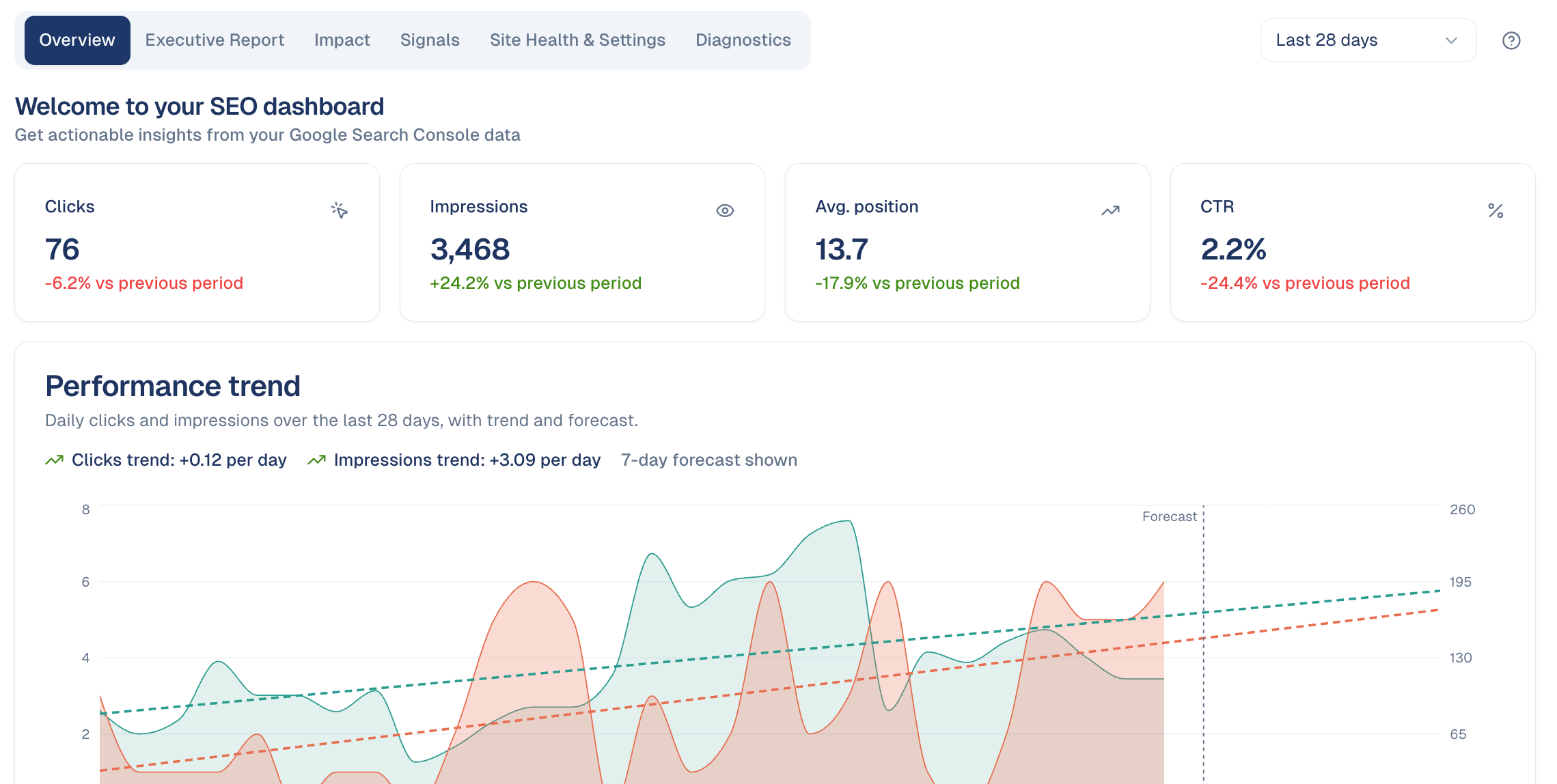
| Figure | What it means |
|---|---|
| Clicks | Visits from Google search results. |
| Impressions | How often your pages appeared in results. |
| Avg. position | Where you appear on average; lower is better (1 is the top). |
| CTR | Clicks divided by impressions. |
Under the trend, Patterns detected points out runs of days above or below average.
The tabs
| Tab | What it shows |
|---|---|
| Overview | The figures above and the trend. |
| Executive Report | A one-page read for someone who does not want the detail, with business outcomes from Google Analytics and a written summary. |
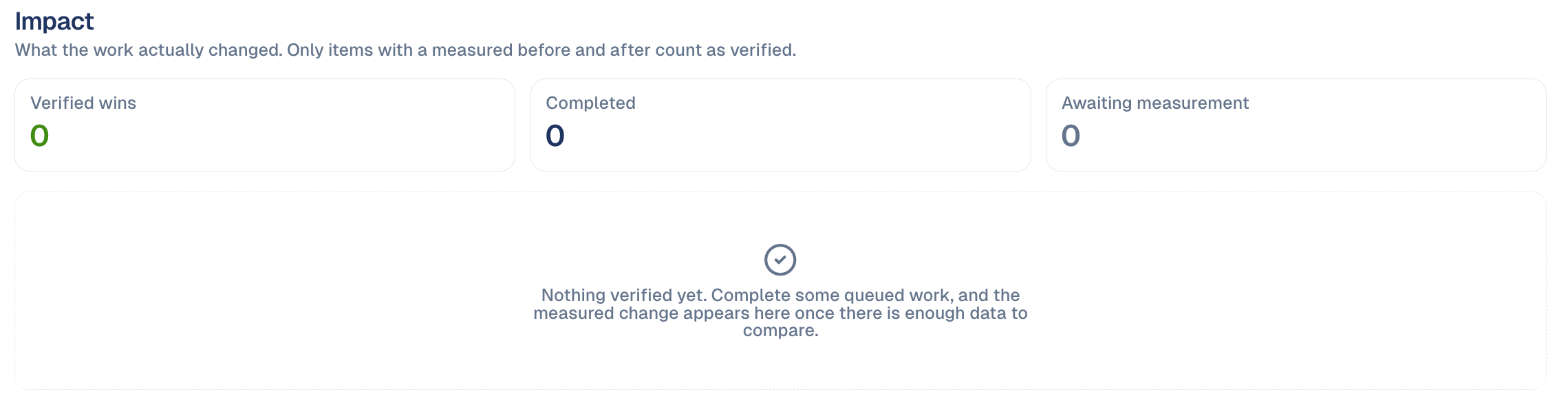
| Impact | What your work actually changed. Only items with a measured before and after count as verified. |
| Signals | Patterns in your figures that are unlikely to be chance. Most weeks have none, and that is a result too. |
| Site Health & Settings | Your site's type and language, which tune what the screens show and the advice they give. |
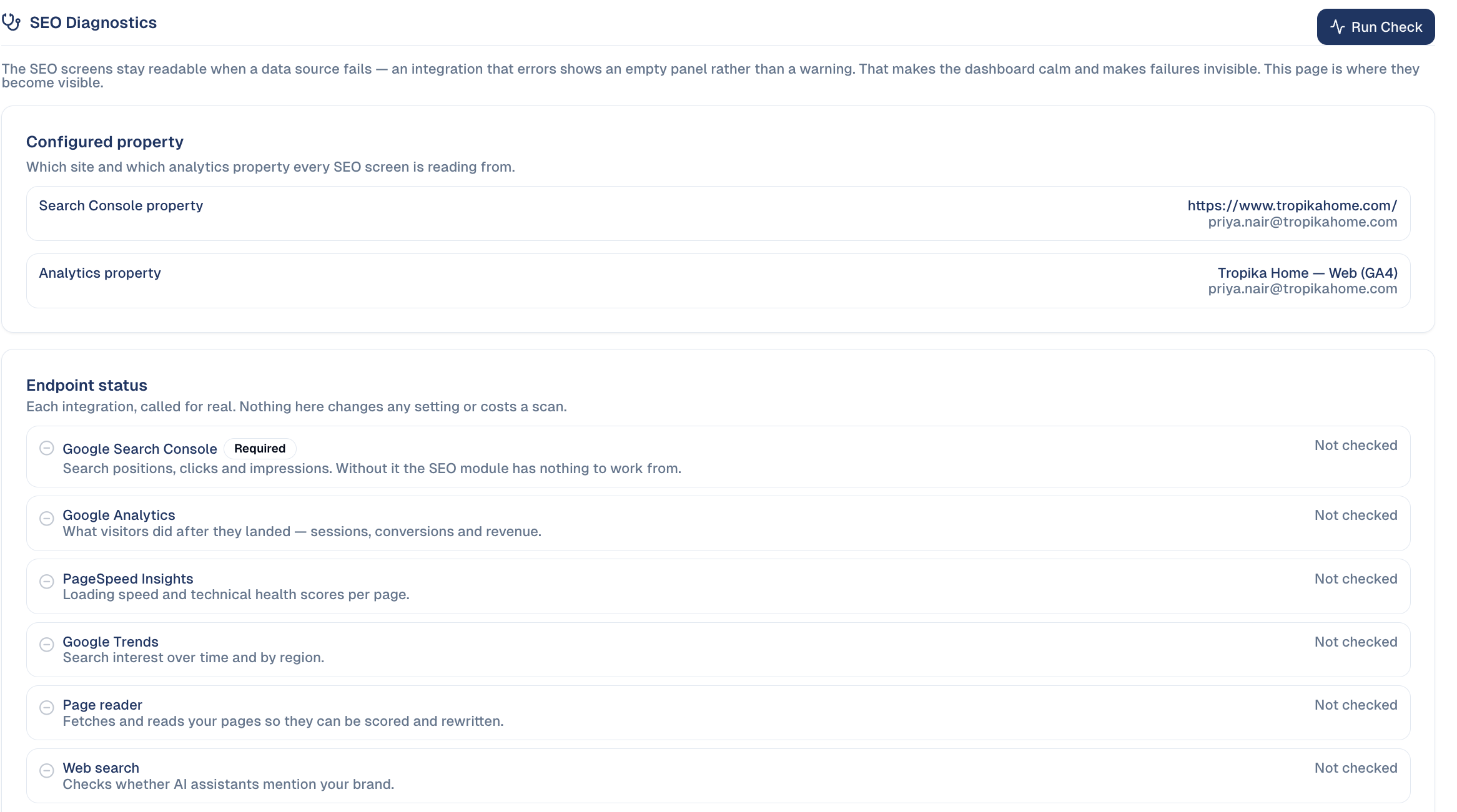
| Diagnostics | Which site and analytics property the screens read, and whether each Google connection works. |
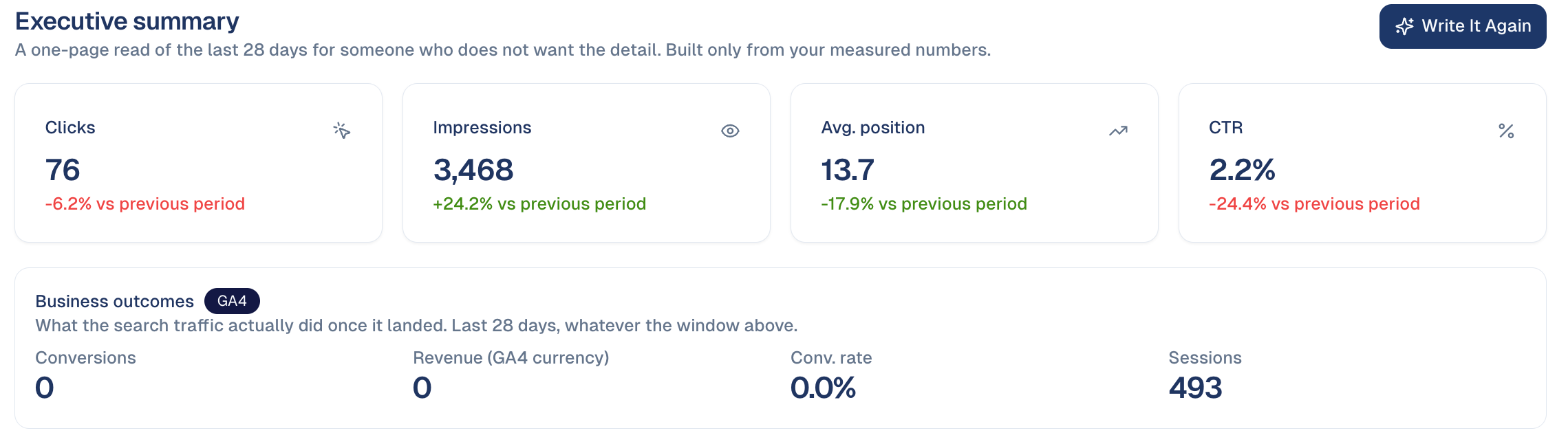
Write It Again rewrites the summary for your manager from the latest numbers.
Impact: did the work pay off?
Every fix you complete from Actions is measured: the page's figures before the change against after. Verified wins are fixes with a measured improvement; Awaiting measurement are fixes too recent to judge yet.
Diagnostics: when a screen looks empty
A screen looks empty?
Open the Diagnostics tab first. It shows which site and analytics property the screens read, and whether each Google connection works.
Choose Run Check to test each connection for real. Nothing changes, and no scan is used.
Good to know
Position going down is good news
A lower average position means you moved up the results: from 17.5 to 13.7 is progress.
- Impressions up, clicks flat usually means you rank for more searches but the titles do not make people click. See Page Fixes.
- Search Console data is two to three days behind. The last days of the period are not complete yet.
Still stuck? Contact support.