Campaigns
Group related marketing activity under one plan, with a shared objective and a start and end date.
What it's for
A campaign is a container for everything you are doing towards one goal: a product launch, an event, a seasonal push. Instead of tracking a dozen separate posts and emails, you see them together and track whether the goal is being met.
One post or one email? Skip the campaign
If you only want to publish one thing, you do not need a campaign. Use Launch a Tactic instead.
Before you start
- Know your objective, for example Product Launch, Brand Awareness, or Networking With Industry Professionals. You choose one when you create the campaign.
- Know roughly when the campaign should start and finish.
How to create a campaign
- In the sidebar, choose Marketing → Campaigns.
- Choose + Create New Campaign.
- Give it a name, pick an objective, and set the start and end dates.
- Add the tactics that belong to it: the posts, emails and events that work towards the objective.
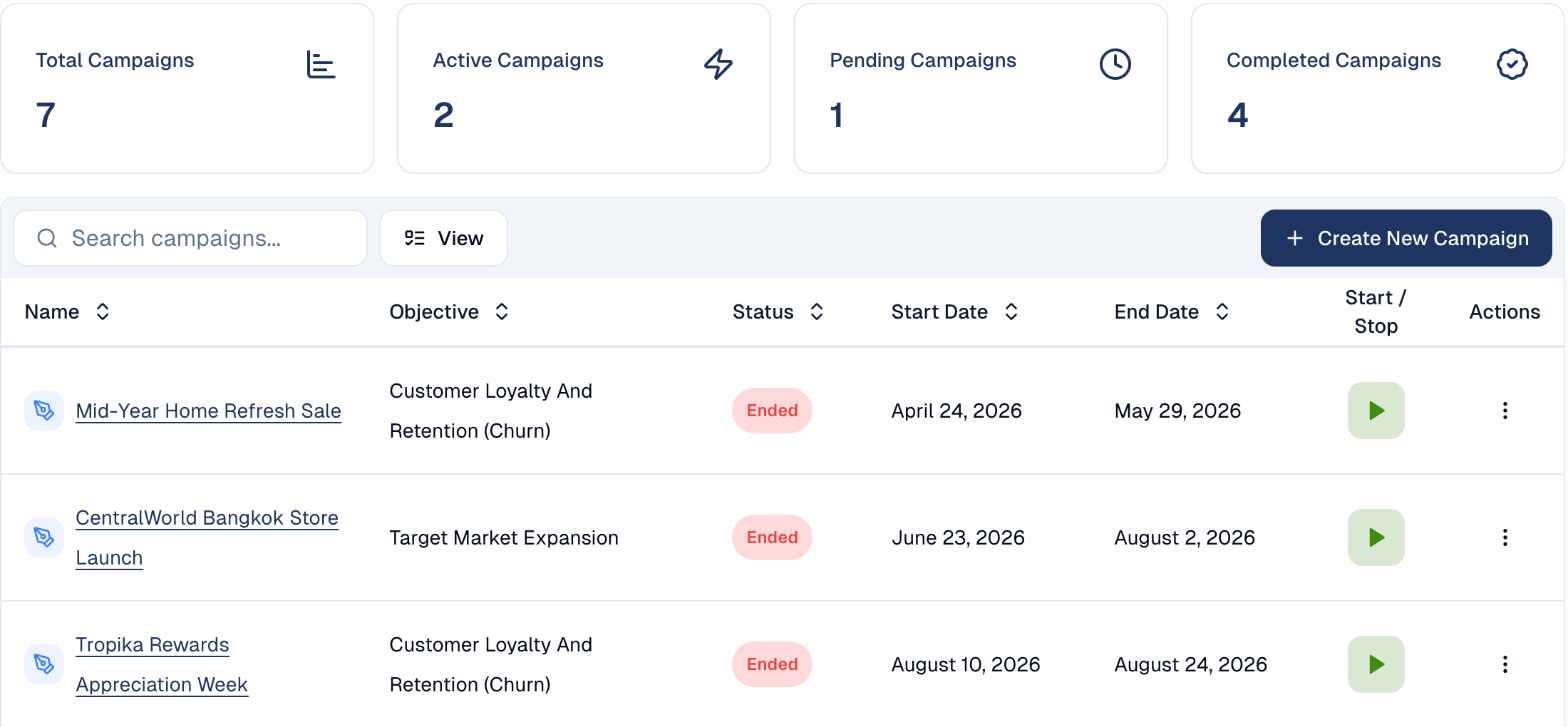
Reading the campaign list
The four tiles across the top summarise where things stand: Total, Active, Pending and Completed Campaigns.
Each row in the table shows the campaign's objective, its status, and the dates it runs between. Sort by any column using the arrows beside the heading.
| Status | What it means |
|---|---|
| Pending | Created, but not started yet. |
| Active | Currently running. |
| Ended | Finished. |
Inside a campaign
Choose a campaign's name to open it. Its tabs are Overview, Budget, Calendar and Analytics.
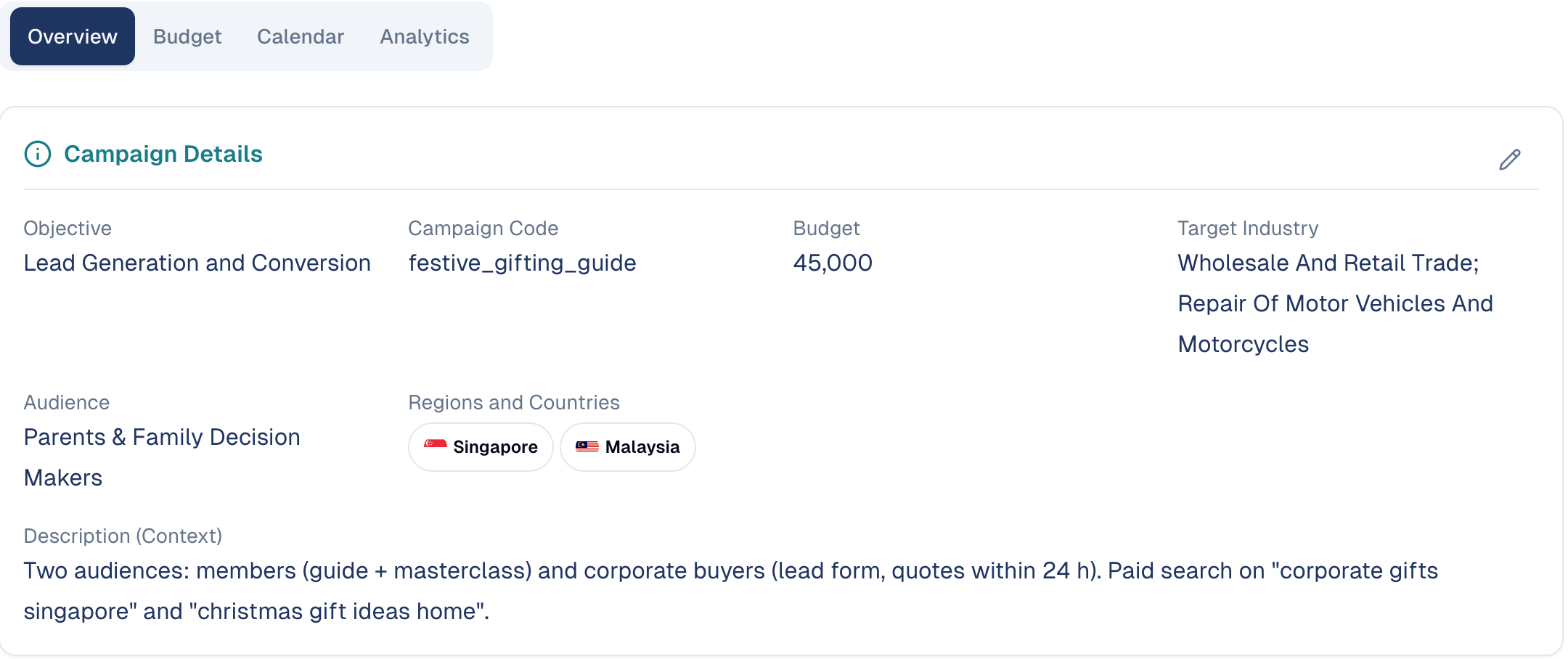
Overview shows the Campaign Details: objective, budget, target industry, audience, regions, and a description the AI uses as context whenever it writes for this campaign. Choose the pencil to change them.
Below, Tactics lists everything the campaign runs: ads, blog posts, social posts, emails and events, each with its status and end date.
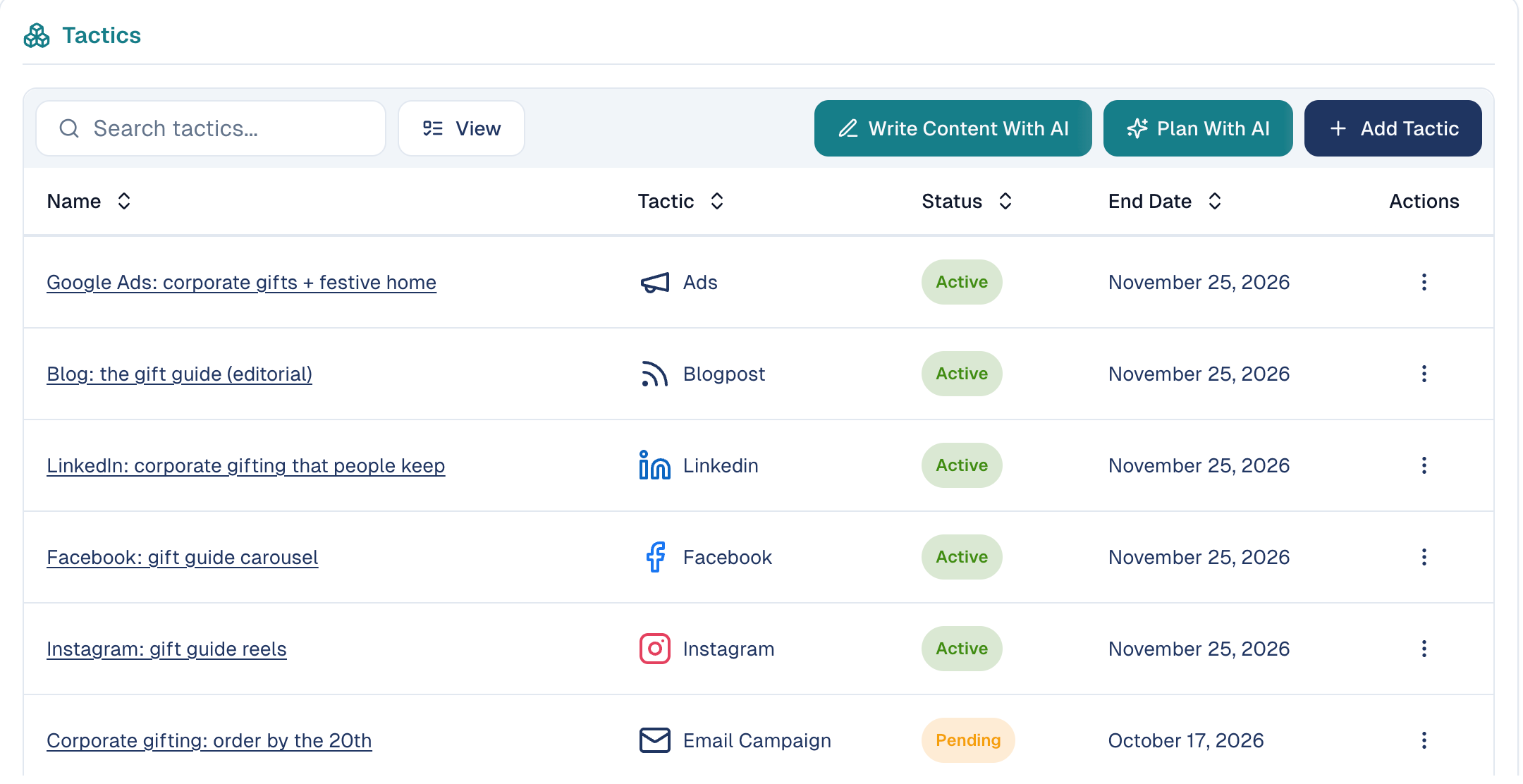
- Add Tactic adds one yourself.
- Plan With AI suggests the tactics that fit the campaign's objective.
- Write Content With AI drafts the content of the tactics.
Duplicating a tactic
To run a tactic again, for example last year's festive email, choose Duplicate in the tactic's menu. Give the copy a name and a destination campaign (the same one or another). The copy starts as a draft: dates, status and figures are reset; budget, description and audience are kept.
For its emails and content, choose:
- Reuse existing assets: the copy uses the same emails and posts.
- Create new copies: fresh copies, so the original is never touched.
Reused assets are shared
With Reuse existing assets, editing an email or post later changes it in both tactics. Choose Create new copies if the two must differ.
For an event, its settings are copied too, and its registration form is always duplicated so the two events keep their registrations apart.
The copy gets its own tactic code (the original's code followed by -copy), so
Google Analytics never mixes the two tactics.
Reading a social tactic's results
Once a LinkedIn, Facebook, Instagram, X or TikTok post is published, the tactic shows a Performance by post card under its posts, with one colour per post in every chart:
- Link clicks: people who opened the links in each post.
- Reach & Visibility: impressions of each post.
- Engagement Trends: clicks, likes, shares or comments of each post.
Reach and engagement are the network's figures, collected by the daily report: running totals since publication, so a post appears the day after it is published. Pick Since publish, 7, 30 or 90 days above the charts, and choose a post's name to open its analytics. The same card appears when you open the tactic from the campaign's Analytics tab, where the campaign charts keep one colour per tactic.
View analytics in a published post's menu opens the same view for one post:
- Link clicks (tracked): people who opened the links in the post, day by day, and how many clicks each link got.
- The network's own figures for the post (impressions, reactions, comments, shares…), from the latest daily report. They appear the day after publishing.
\"Clicks on LinkedIn\" is a different number
The network counts every click on the post (image, "see more", profile); link clicks count only the people who opened your links.
- Bots are left out. When a post is published, the network fetches its links to build the preview card; those visits are not counted. Switch on Include bots to see them.
- Days follow your timezone.
- A post linked from outside GoodBards has no tracked links: it shows the network figures only.
Tracking links in Google Analytics
Every link GoodBards shortens in a campaign's emails and social posts carries UTM tags, so its visits show up in your Google Analytics reports:
| Tag | Value | Example |
|---|---|---|
utm_campaign |
the campaign code | summer-sale-2026 |
utm_content |
the tactic code: tells two tactics of the same campaign apart | launch-post |
utm_source |
where the click comes from, set from the tactic type | linkedin, facebook, newsletter for emails, event for event emails |
utm_medium |
the channel family, set from the tactic type | social or email |
- The codes are optional. Leave them empty and GoodBards writes one from the
name ("Summer Sale 2026" becomes
summer-sale-2026) and keeps it, even if you rename the campaign later. - Format: lowercase letters, digits,
-and_, up to 50 characters. A campaign code is unique in your workspace, a tactic code within its campaign. - Source and medium can't be edited, so every campaign is named the same way in your reports. The tactic form shows the tags its links get.
Your own tags win
A link that already contains utm_ tags is left as you wrote it.
- Ads and blog posts get no tags: Google Ads tags its own clicks, and tags on links to your own website would overwrite your visitors' real source.
The Budget tab
The Budget tab splits the campaign's budget across its tactics. On the left, how much is used of the total, with the remaining amount, the amount Allocated (choose the pencil to change it) and the average per tactic. On the right, every tactic with its own budget; choose the pencil on a row to change it.
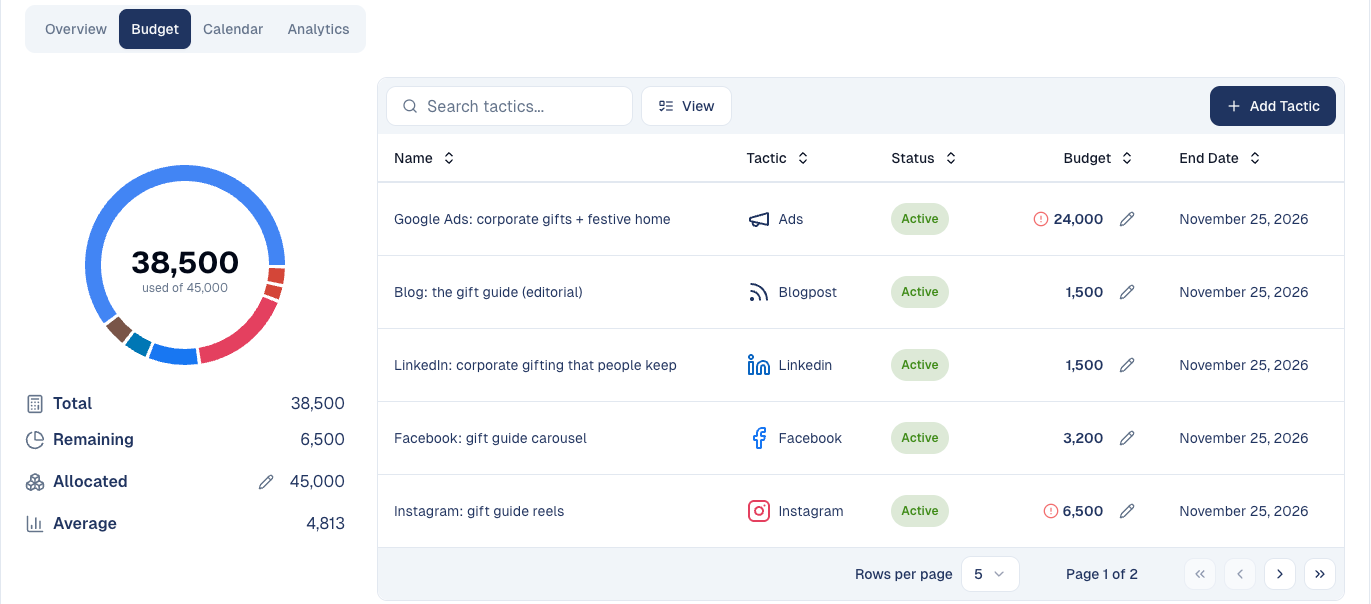
A red mark next to a tactic's budget means it is above the average budget per tactic. The tactic budgets are your plan. For ads, Google Ads spends its own daily budget; see Ads in a campaign.
The campaign report
The Analytics tab gathers the results of every tactic in one place: reach and engagement on social networks, email deliveries, opens and clicks, event registrations and attendance, and ad spend and returns. Each figure shows its change against the previous report. Use the arrows to move between report dates, or History to see them all.
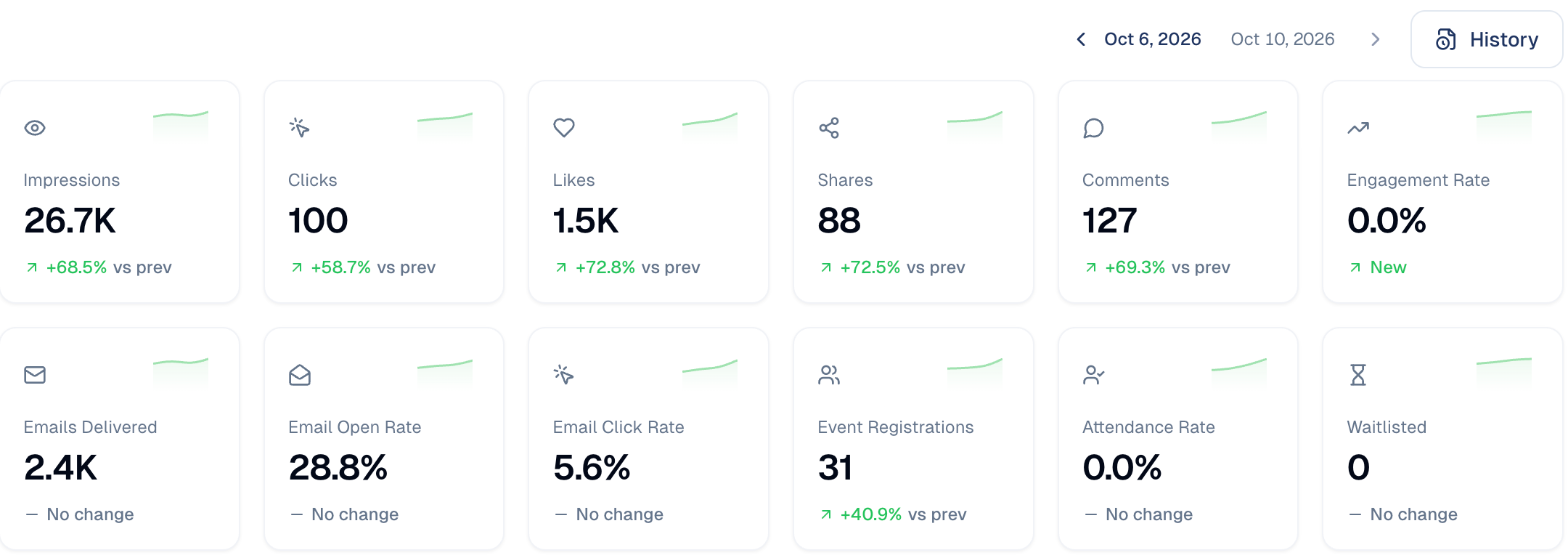
Below the totals, a table lists every tactic with its own figures. Choose one to open its details: the same figures for that tactic alone, and its share of the campaign total.
Starting and stopping
The Start / Stop column controls whether a campaign is running:
- ▶ Start begins a pending campaign.
- ⏸ Pause stops an active one.
Pausing deletes nothing
It stops further activity until you start the campaign again.
Good to know
- A campaign is a plan, not a channel. Publishing still happens through the individual tactics inside it.
- Name campaigns so you can find them later. Something like
Q4-2026-Product-Launchis easier to search thanNew campaign. - End dates are not deadlines. A campaign past its end date stays visible in the list; the date describes the plan, it does not stop work by itself.
Still stuck? Contact support.