Google Analytics
See how many people visit your website, where they come from, and what they do when they arrive.
What it's for
Your website is usually where marketing ends up: the click from an email, the link in a social post, the QR code on a flyer. Google Analytics tells you whether any of it worked.
Bringing it into GoodBards means you can read your traffic beside your campaigns, rather than switching to a separate tool.
Before you start
- Your plan. Google Analytics is included in the Pro and Full plans.
- Google Analytics connected under Connectors, with a GA4 property chosen. If this page says you are not connected, start at Connections.
How to read your traffic report
- In the sidebar, choose Organic Visibility → Google Analytics.
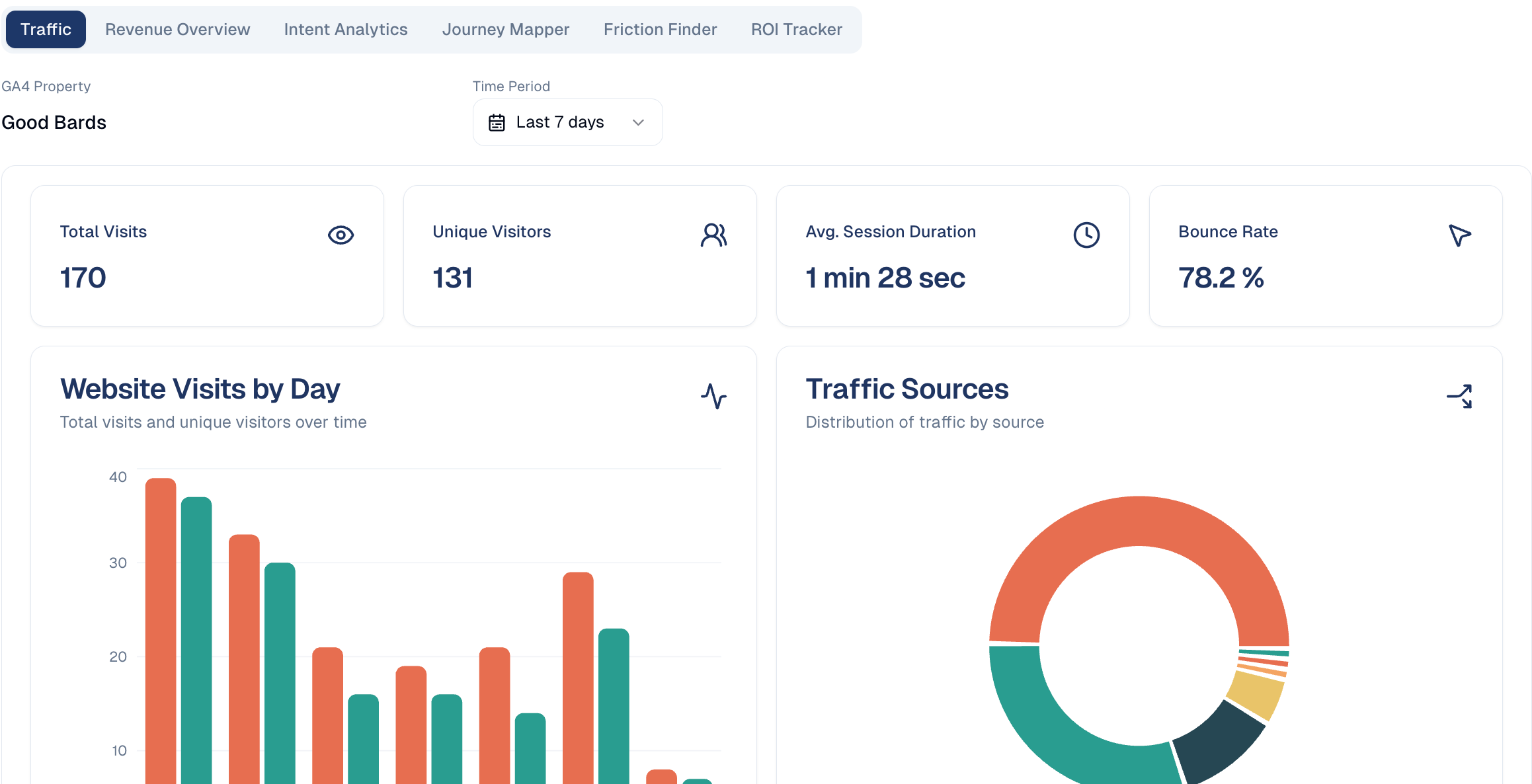
- Check the GA4 Property shown: this is the website being reported on.
- Pick a Time Period, such as Last 7 days.
Give it a moment
This page pulls live data from Google and can take several seconds to fill in. Empty charts usually mean it is still loading, not that there is no data.
The four headline numbers
| Metric | What it means | What to watch for |
|---|---|---|
| Total Visits | Every visit, including repeat visits by the same person. | Sudden drops usually mean a technical problem. |
| Unique Visitors | How many different people visited. | The gap between this and total visits shows how often people return. |
| Avg. Session Duration | How long a visit lasts. | Very short sessions suggest visitors are not finding what they expected. |
| Bounce Rate | The share who left without going any further. | High bounce on a campaign landing page means the page is not matching the promise that brought them there. |
The charts
Website Visits by Day plots visits and unique visitors over time. Use it to check whether a campaign moved the numbers: look for the lift on the days you published.
Traffic Sources breaks visits down by where they came from: search, social, direct, referral. This is the chart that tells you which channel is actually delivering.
The other tabs
| Tab | What it shows |
|---|---|
| Traffic | Visits, visitors and sources, as above. |
| Revenue Overview | Revenue attributed to your website. |
| Intent Analytics | What visitors appear to be looking for. |
| Journey Mapper | The paths visitors take through your site. |
| Friction Finder | Where visitors get stuck or drop out. |
| ROI Tracker | Return on your marketing spend. |
Return to Friction Finder and Journey Mapper
Traffic tells you how many arrived; these two tabs tell you why they left.
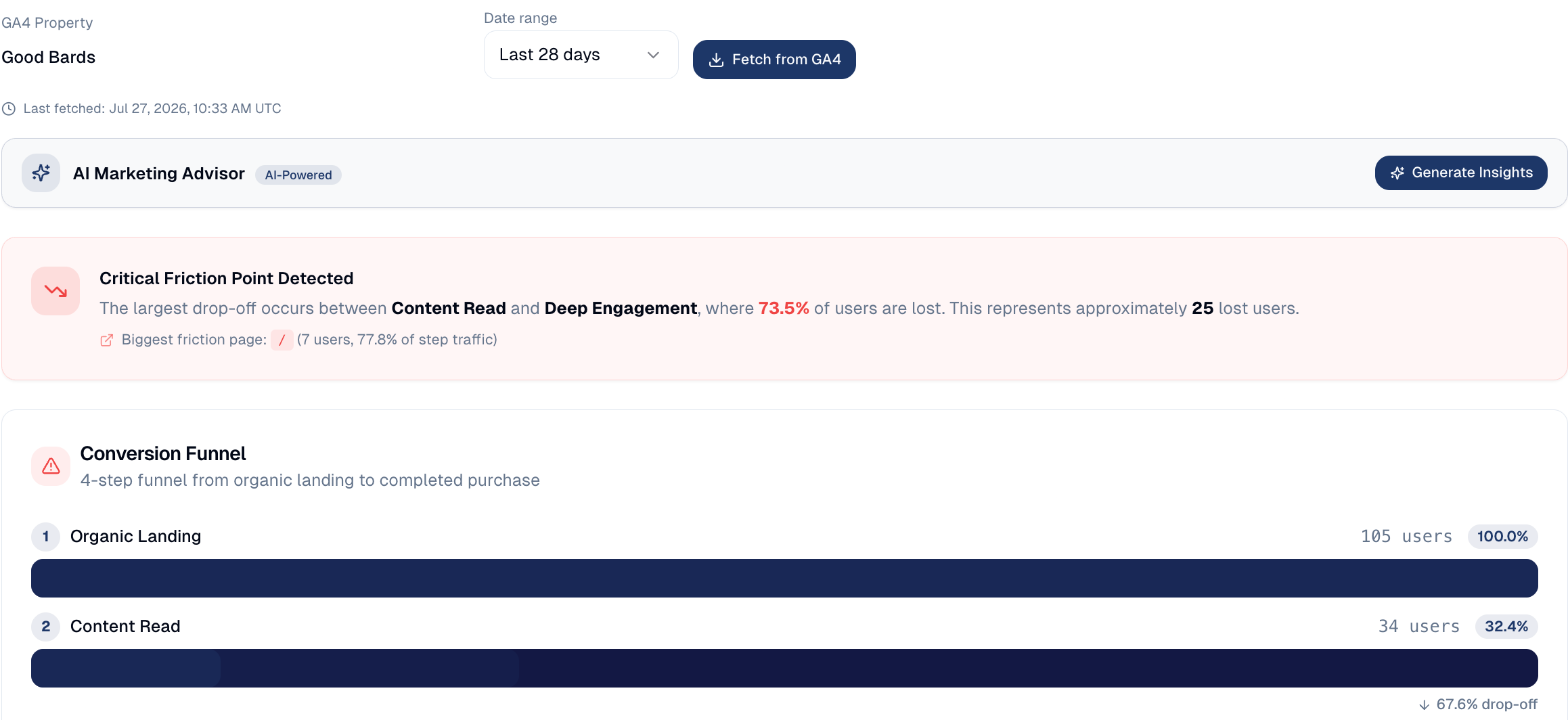
Friction Finder
A four-step funnel from arriving through search to buying, and the step where most people are lost, with the page responsible.
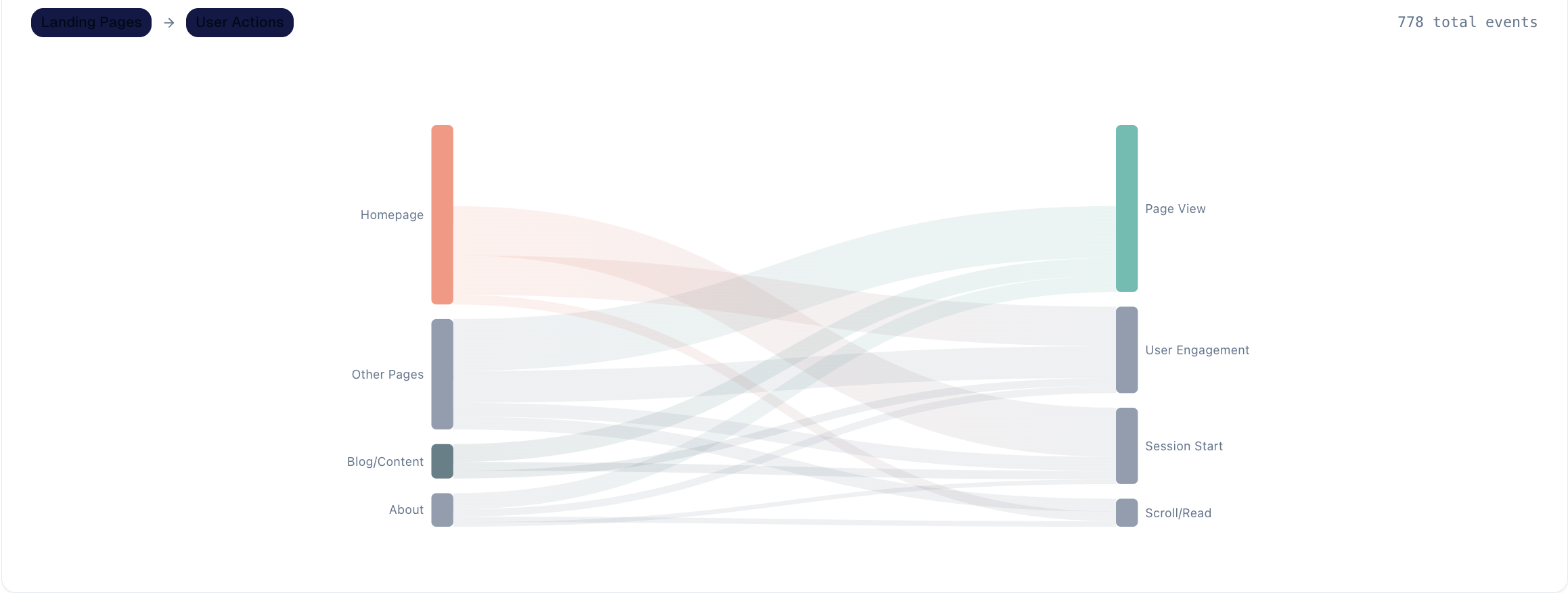
Journey Mapper
Where people arriving from search land (left) and what they do next (right). Hover a band to highlight one path.
On these analysis tabs, Fetch from GA4 loads the latest figures for the date range; the date of the last fetch is shown under it. Generate Insights asks the AI Marketing Advisor what to do about what it sees.
Good to know
- Check the property. If the figures look wrong, confirm the GA4 Property is the site you meant: an account can hold several.
- Compare like with like. Traffic has weekly rhythms, so compare a week with a week rather than a weekend with a Tuesday.
- Analytics data lags slightly. Today's numbers may still be settling; judge campaigns after a few days.
Still stuck? Contact support.