Conversation Compass
All your social networks on one page: how big your audience is, how it reacts, and when and what to post. Mostly charts, short on text.
What it's for
Each network has its own report. The Compass puts them side by side so you can answer the questions that span them: which network deserves more effort, when your audience is listening, which content works everywhere and which only works on one network.
Before you start
- Your plan. Social Media is included in the Pro and Full plans. The AI Strategy Compass at the bottom of the page is not available on the free plan.
- At least one connected network, under Connectors. See Connections.
- One night. The Compass reads what the nightly report of each network collected. A network connected today appears tomorrow morning.
Nothing is fetched when you open the page
The Compass only reads the figures GoodBards already collected overnight, so it opens quickly and never uses your networks' daily limits.
How to read the Compass
- In the sidebar, choose Social Media → Analysis. The Conversation Compass tab opens first.
- Choose the period at the top right: 7 days, 30 days or 90 days. The same period applies to the network tabs.
- Read the page from top to bottom: the headline numbers, then the charts.
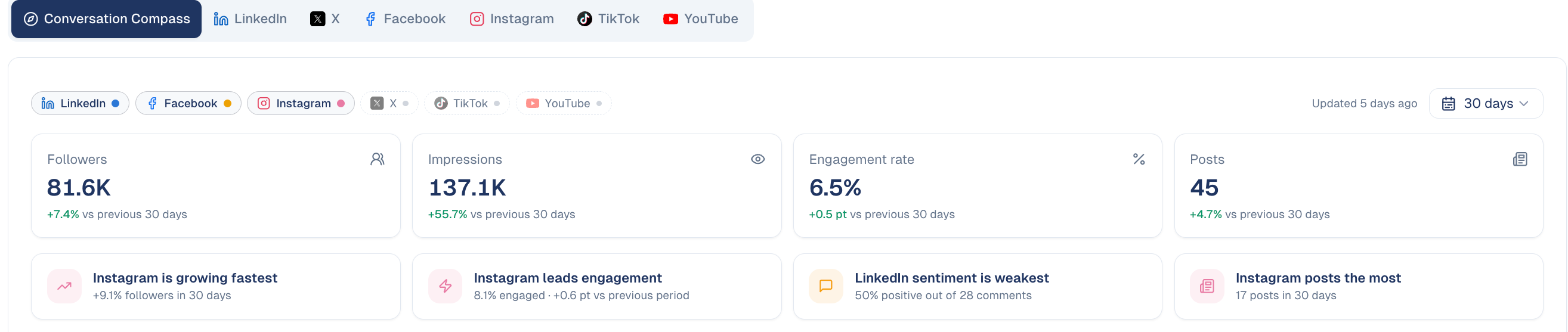
Choose the networks
The chips at the top list your networks. Every network with data is ticked. Click a chip to take that network out of every number and chart on the page; click it again to bring it back, or choose Show all.

A chip with a dashed outline is a network without data: an amber dot means it is connected and waiting for its first nightly report, a grey dot means it is not connected. Clicking it opens that network's tab, where you can connect it.
The headline numbers
Followers, Impressions, Engagement rate and Posts add up your networks. Under each one, the change against the previous period of the same length, in green when it went up and red when it went down. The four cards below name the network that grew fastest, the one that engages best, the one with the weakest sentiment and the one that posts the most.
One engagement rate for every network
Engagement rate is likes, comments, shares and saves divided by impressions, the same way for every network so you can compare them. On TikTok and YouTube, impressions are views.
Across networks
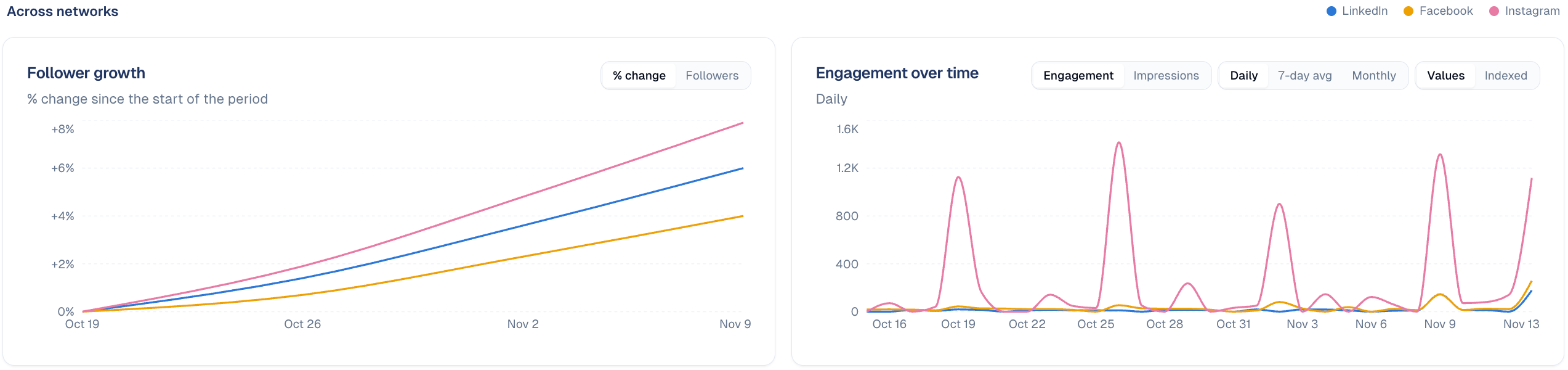
Follower growth shows each network's followers over the period, as a % change (so a small network and a big one fit on the same chart) or as a count. Engagement over time shows engagement or impressions per day, as a 7-day average or per month, as values or Indexed (each network starts at 100).
When to post
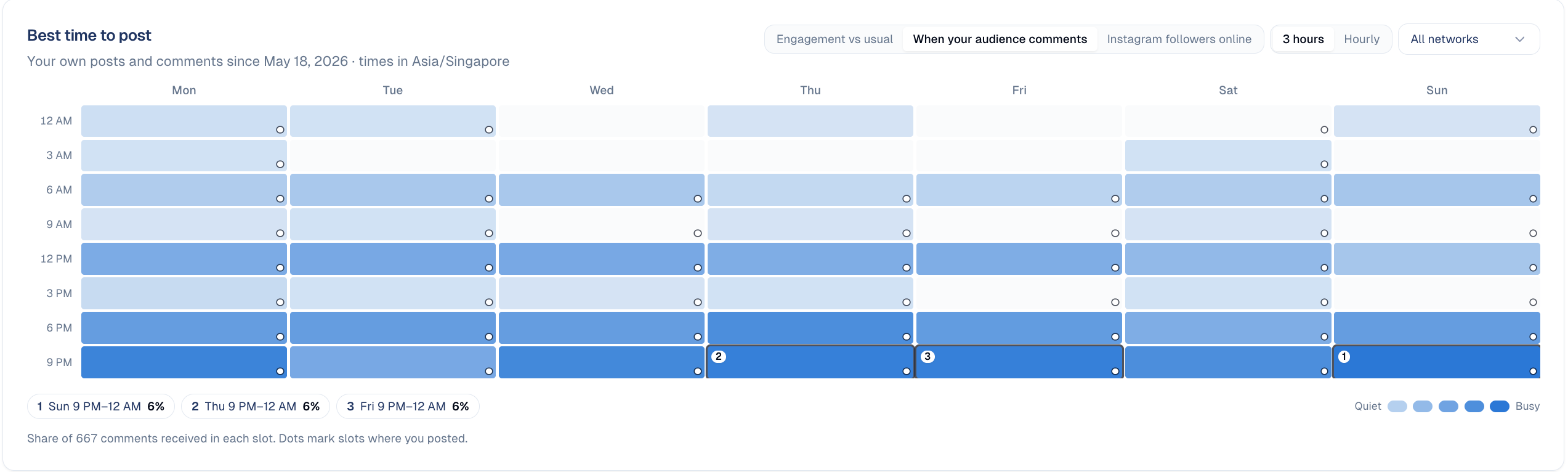
Best time to post is a week grid: days across, 3-hour slots down, in your own time zone. It is built from your posts, not from an industry average.
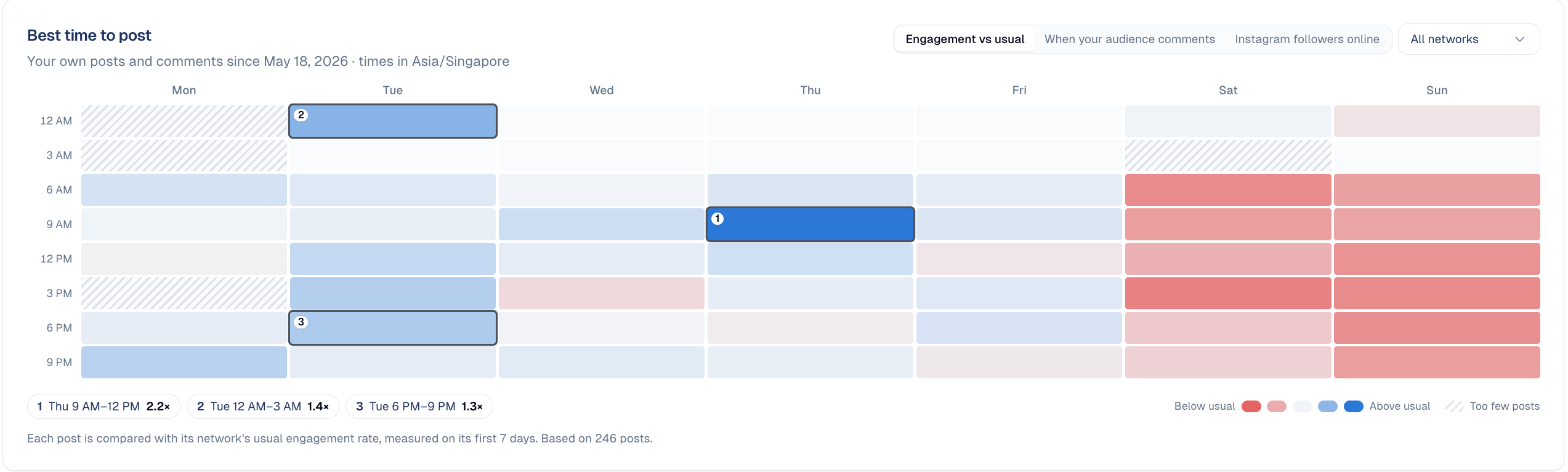
- Each post is compared with the usual engagement of its network, measured on its first 7 days. Blue slots do better than usual, red slots worse, grey ones about the same. This way a LinkedIn post and an Instagram post can share the grid fairly.
- The 3 best slots are numbered on the grid and listed below it.
- A hatched slot has only one post: too few to judge.
- All networks lets you look at one network at a time.
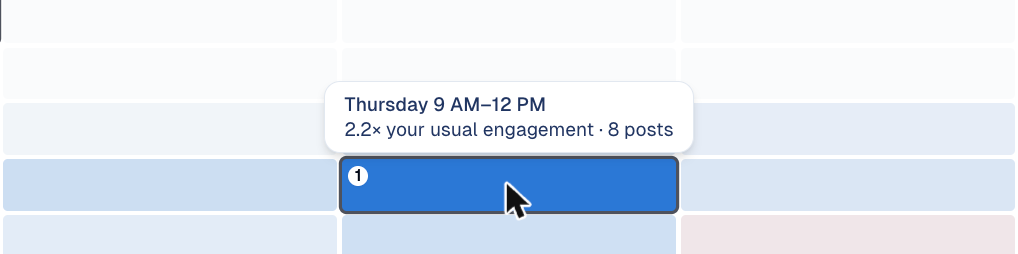
Hover a slot to see its figure and how many posts it is based on.
It needs 30 posts
The grid looks back at least 6 months and judges posts once they are 7 days old. Below 30 such posts it shows a message instead of a grid that would mislead you.
When your audience comments shows when people comment on your posts, so you can see when your audience is around. A dot marks the slots where you actually posted.
Instagram followers online shows, hour by hour, how many of your Instagram followers are online, as reported by Instagram and averaged over the last 30 days.
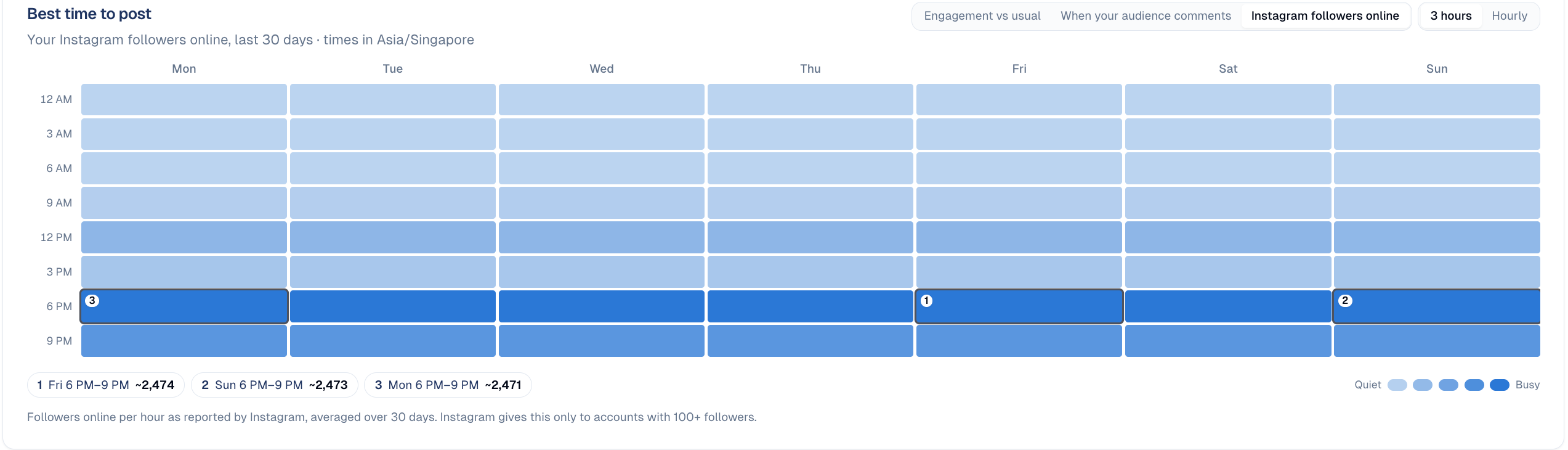
Instagram only, 100 followers and more
Instagram gives this figure only to accounts with at least 100 followers, and keeps 30 days. GoodBards stores it every night, so the view appears the day after the first nightly report.
What you post and what people say
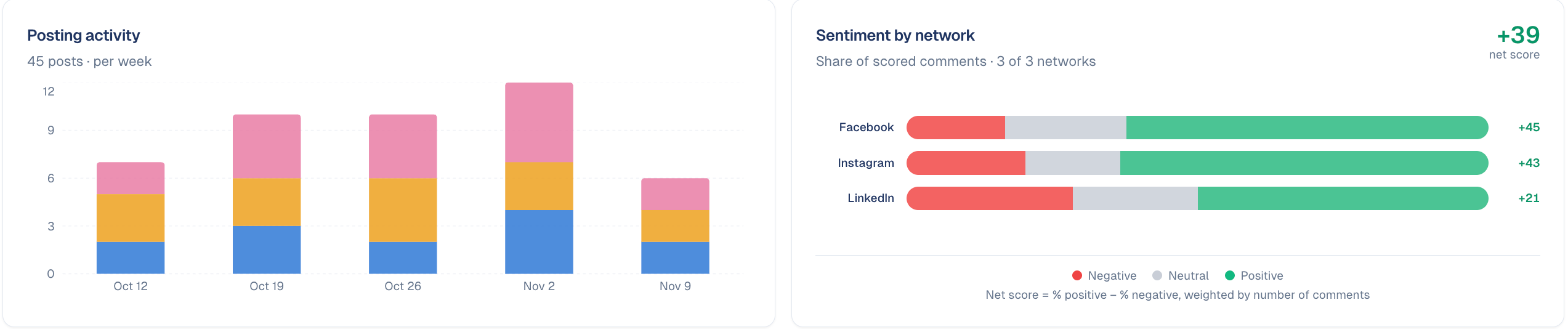
Posting activity counts your posts per week (per day on a 7-day period), one colour per network. Sentiment by network shows the share of negative, neutral and positive comments on each network; the net score at the top right is positive minus negative, over all comments.
Comments not collected
GoodBards reads the comments of LinkedIn, Facebook, Instagram and YouTube. X and TikTok only give a number of comments, so their sentiment shows Comments not collected for this network.
Where to invest
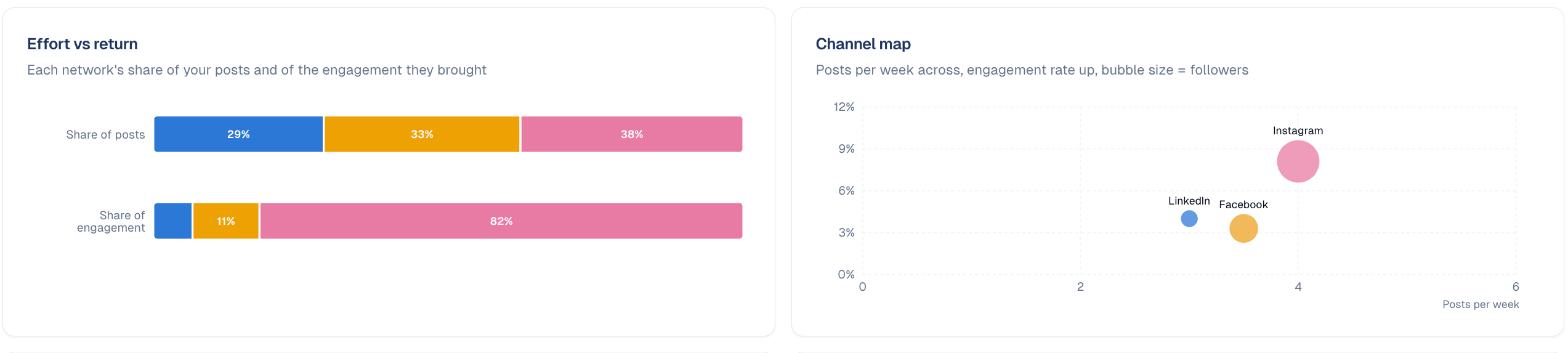
Effort vs return puts each network's share of your posts next to its share of the engagement you received. A network that takes a third of your posts and brings a tenth of your engagement is worth a second look.
Channel map shows one bubble per network: posts per week across, engagement rate up, bubble size for followers. Top right is where a network works hard and well.
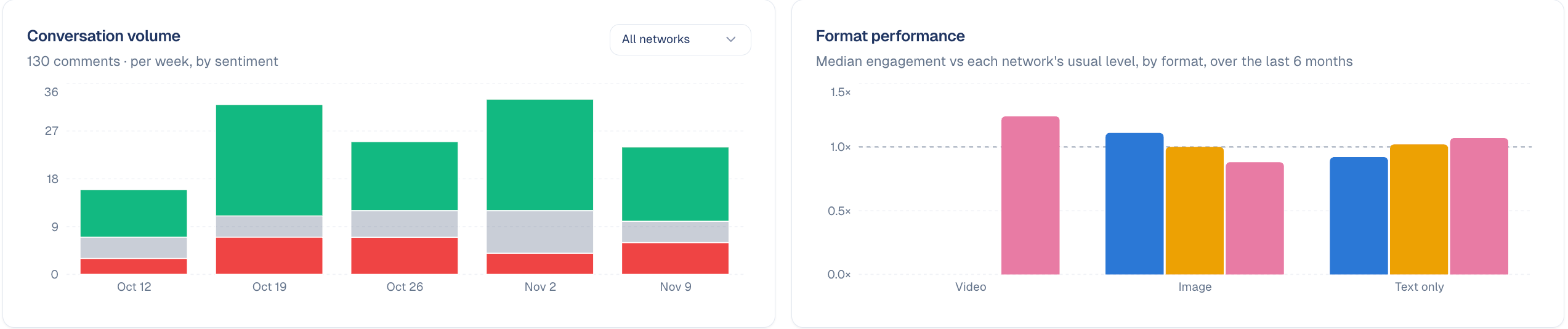
Conversation volume counts the comments you received per week, coloured by sentiment, for all networks or one. Format performance compares video, image and text-only posts, each against its network's usual level: a bar above the dashed line does better than usual.
What works
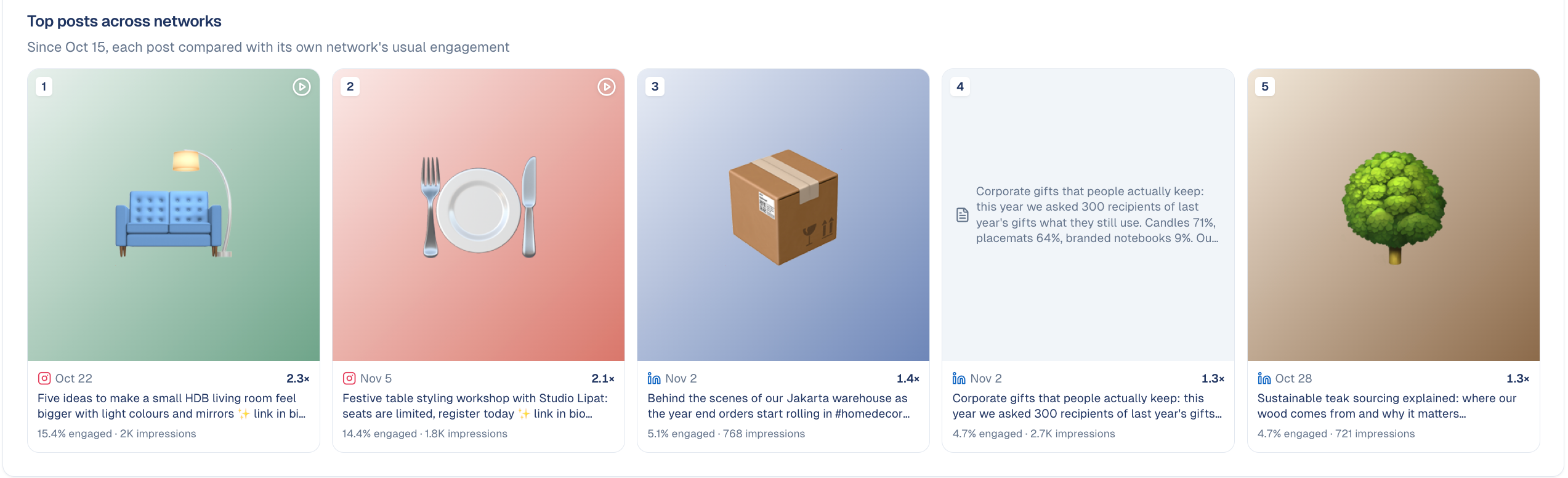
Top posts across networks shows your 5 best posts, ranked by engagement rate. Use Sort by to rank them by Impressions, Engagements, Clicks, Likes or Shares instead, or by Vs usual: each post compared with the usual engagement of its own network, so a strong LinkedIn post can rank above an Instagram post that simply has more likes. Click a post to open it on its network.
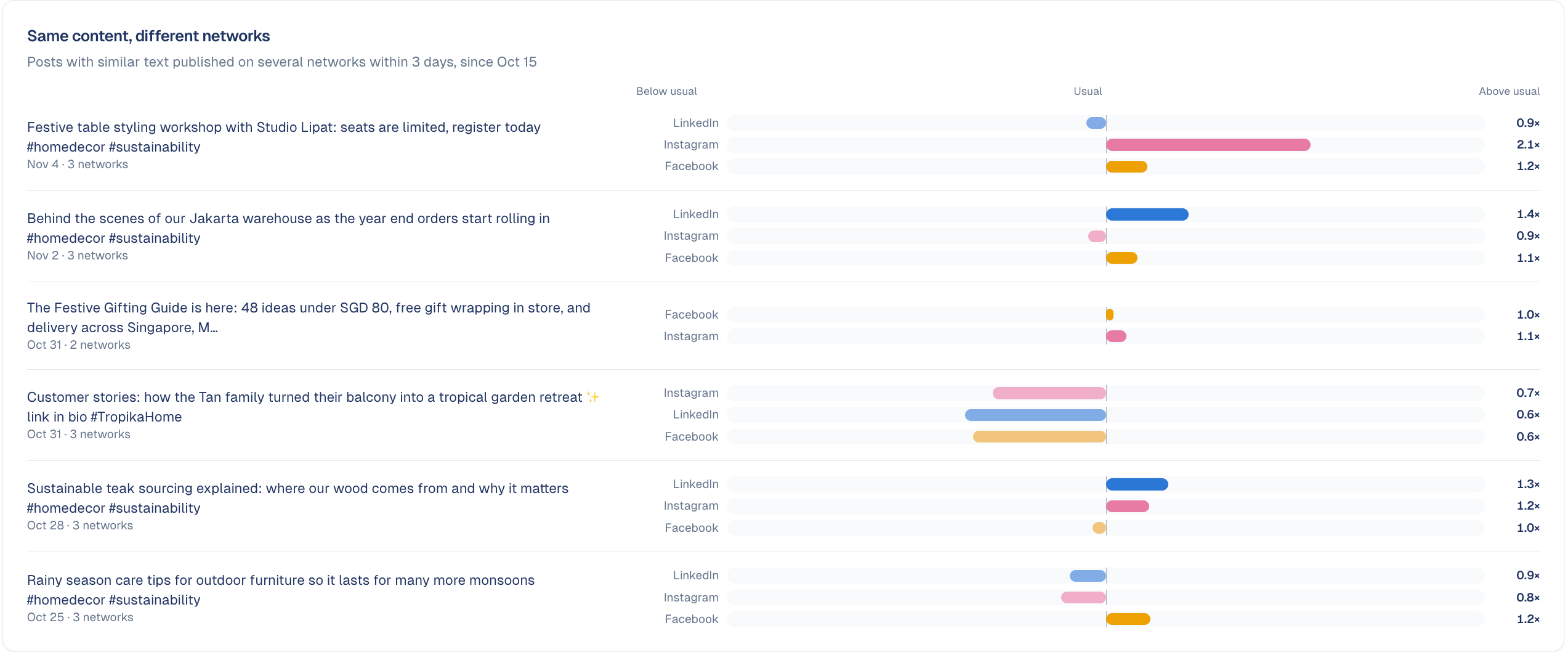
Same content, different networks finds posts with similar text published on several networks within 3 days, and shows how each network did against its own usual level. Bars to the right of Usual did better, to the left worse.
AI Strategy Compass
At the bottom of the page, the AI reads the numbers above and writes advice, only when you ask:
- 3 action items: three things to do this week, each based on a figure.
- Full report: a summary, a diagnosis network by network, content opportunities, a sentiment watch, a posting schedule and the 3 actions.

The reading is kept for the rest of the day, in your language: opening the page again shows it at no cost. Regenerate asks the AI again and uses your AI credits.
What the AI sees
Only the totals and rates shown on this page. It never sees the text of your posts or comments. It covers all your networks, whatever chips are unticked.
Good to know
- Figures are from last night. Updated … at the top shows when the networks were last read.
- A new connection starts from zero. Follower history, daily engagement and the first-week figures of a post begin the day GoodBards first reads the account.
- Only company accounts count. LinkedIn personal profiles stay in the LinkedIn tab.
- Times follow your profile's time zone, set in your personal preferences.
- Small numbers move a lot. A slot or a format based on 2 or 3 posts is a hint, not a rule: the tooltip always says how many posts are behind a figure.
Still stuck? Contact support.