Analysis
See how your social content performed: reach, engagement, and how people reacted to it.
What it's for
Posting is only half the job. This is where you find out whether anyone saw a post, whether they engaged with it, and whether the reaction was positive.
Use it to decide what to do more of. A post with high impressions but almost no clicks tells you something different from one with few impressions and strong engagement.
Before you start
- Your plan. Social Media is included in the Pro and Full plans.
- A connected account for each network you want to report on, under Connectors. See Connections.
LinkedIn: company pages only
LinkedIn gives figures for company pages, not for personal profiles. A tab whose network is not connected has no report.
How to review social performance
- In the sidebar, choose Social Media → Analysis. It opens on the Conversation Compass, all your networks together: see Conversation Compass.
- Pick a channel from the tabs across the top: LinkedIn, X, Facebook, Instagram, TikTok or YouTube.
- Choose which page or account to report on.
- Use the arrows beside the date to move between reporting days.
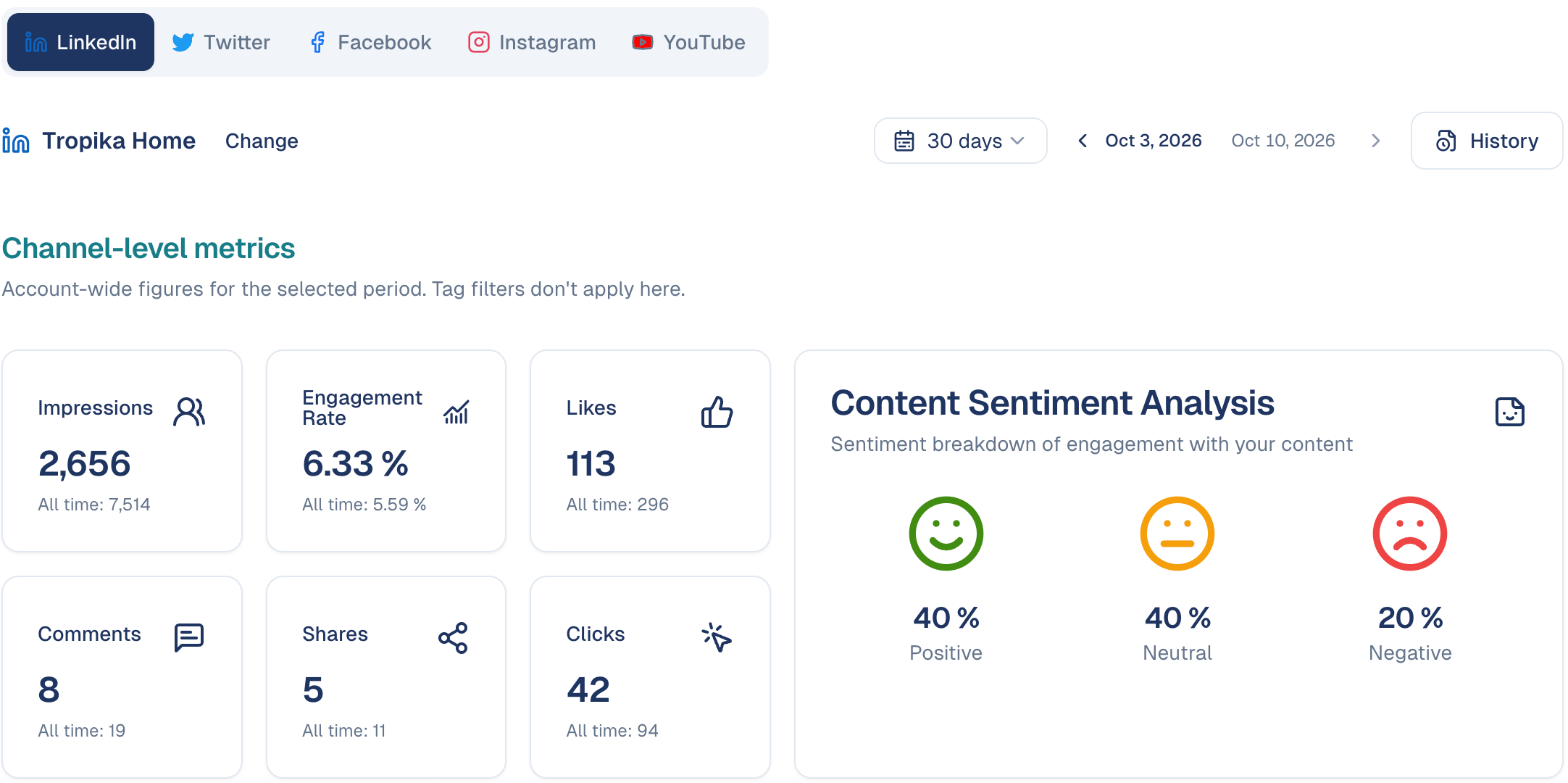
Choose Change beside the organisation name to switch to a different page.
What the numbers mean
| Metric | What it counts | What to read into it |
|---|---|---|
| Impressions | How many times your content was shown. | Reach. Low impressions mean a distribution problem, not a content problem. |
| Engagement Rate | The share of people who interacted. | The single most useful number here: it does not depend on reach. |
| Likes | Straightforward approval. | Easy to earn, weak signal. |
| Comments | People who wrote something. | Far stronger than a like: it costs effort. |
| Shares | People who passed it on. | The strongest signal of all. |
| Clicks | People who followed your link. | The one that matters when the post has a destination. |
Judge posts on engagement rate
Not on raw likes. A post seen by 500 people with 50 interactions is doing better than one seen by 30,000 with 100.
Facebook pages
Impressions, clicks and the Channel Engagements chart come from Facebook's insights, which the page connection has to allow. When it does not, those figures are left out of the report rather than shown as zero. Likes, comments, shares and Fans are always available. Reconnect the page to add insights access.
Content Sentiment Analysis
Beside the metrics, sentiment splits engagement into Positive, Neutral and Negative.
This is worth watching over time rather than per post. A shift towards negative sentiment is worth investigating early: it is easier to address a small complaint than a pattern.
Who your audience is (LinkedIn)
Audience Demographics breaks down the people who follow your LinkedIn page by Role, Seniority, Industry and Company Size. Check that it matches who you sell to: a B2B brand followed mostly by students has a reach problem, not a content problem.
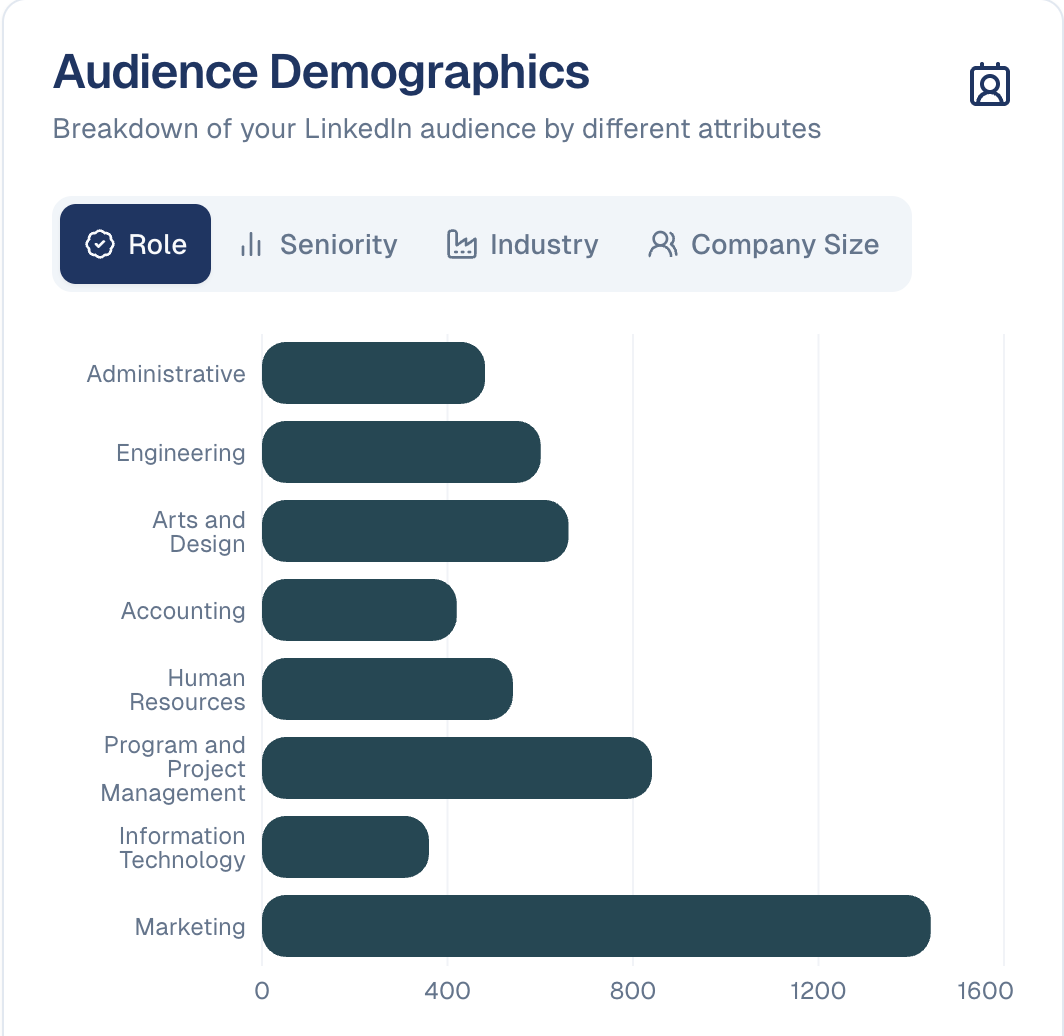
Next to it, Channel Engagements shows the account's daily activity over the period, straight from the network: engagement (split by type on LinkedIn) and impressions.
Top Posts Performance
Below the summary, your best-performing content is listed with its engagement figures, ranked by engagement rate. Use Sort by to rank them by Impressions, Engagements, Clicks, Likes or Shares instead. This is the fastest route to understanding what your audience responds to: look for what the top posts have in common, such as format, topic, tone or time of day.
Stories (Instagram)
Instagram reports have a Stories card for the stories published from GoodBards: views, reach, replies and how people moved through them. A story still showing on Instagram is marked Live, with a link to open it; its numbers are refreshed every 2 hours. After 24 hours the story disappears from Instagram, its numbers are captured one last time and marked Final.
Only stories published from GoodBards
Stories posted directly in the Instagram app are not listed: Instagram does not let GoodBards read them.
TikTok
The TikTok tab shows the connected account: followers, following, likes received and number of videos, then your videos from the last 90 days with their views, likes, comments and shares.
TikTok gives no day-by-day statistics, so GoodBards takes a snapshot of the account every night and works out what changed:
- Views, likes, comments, shares for the period are what your videos gained between snapshots, and the Channel Engagements chart shows them day by day.
- Net followers is the change in followers over the period (it can be negative).
- Numbers start the day after you connect TikTok. The first snapshot is the starting point, so the first days of a new connection show no gains.
- Engagement rate on TikTok is likes, comments and shares per view.
Follower and likes counters missing? The statistics permission was unticked when TikTok was connected: reconnect TikTok and keep every box ticked.
History
History, at the top right, holds previous reports so you can compare periods rather than judging a single day in isolation.
Good to know
- One day is not a trend. Social performance is noisy. Compare across several reports before changing your approach.
- Impressions depend on the platform. Reach is decided by each network's algorithm, so a drop is not necessarily about your content.
- Match the metric to the goal. For awareness, watch impressions; for traffic, watch clicks; for community, watch comments and shares.
Still stuck? Contact support.