Google Trends
See what your market is searching for, when interest peaks, and how two ideas compare.
What it's for
Before committing to a campaign it helps to know whether anyone is looking for what you are about to promote. Google Trends shows search interest over time, so you can spot a rising topic, catch a seasonal peak while it is still climbing, or settle an argument about which of two product names people actually search for.
Before you start
- Your plan. Google Trends is included in the Pro and Full plans.
- The Google Trends connector set up under Connectors. If the page says you are not connected, see Google Trends connector.
How to compare search interest
- In the sidebar, choose Organic Visibility → Google Trends.
- Type a term into Add a search term and press Enter.
- Add a second term to compare against the first.
- Set Location and Time Period.
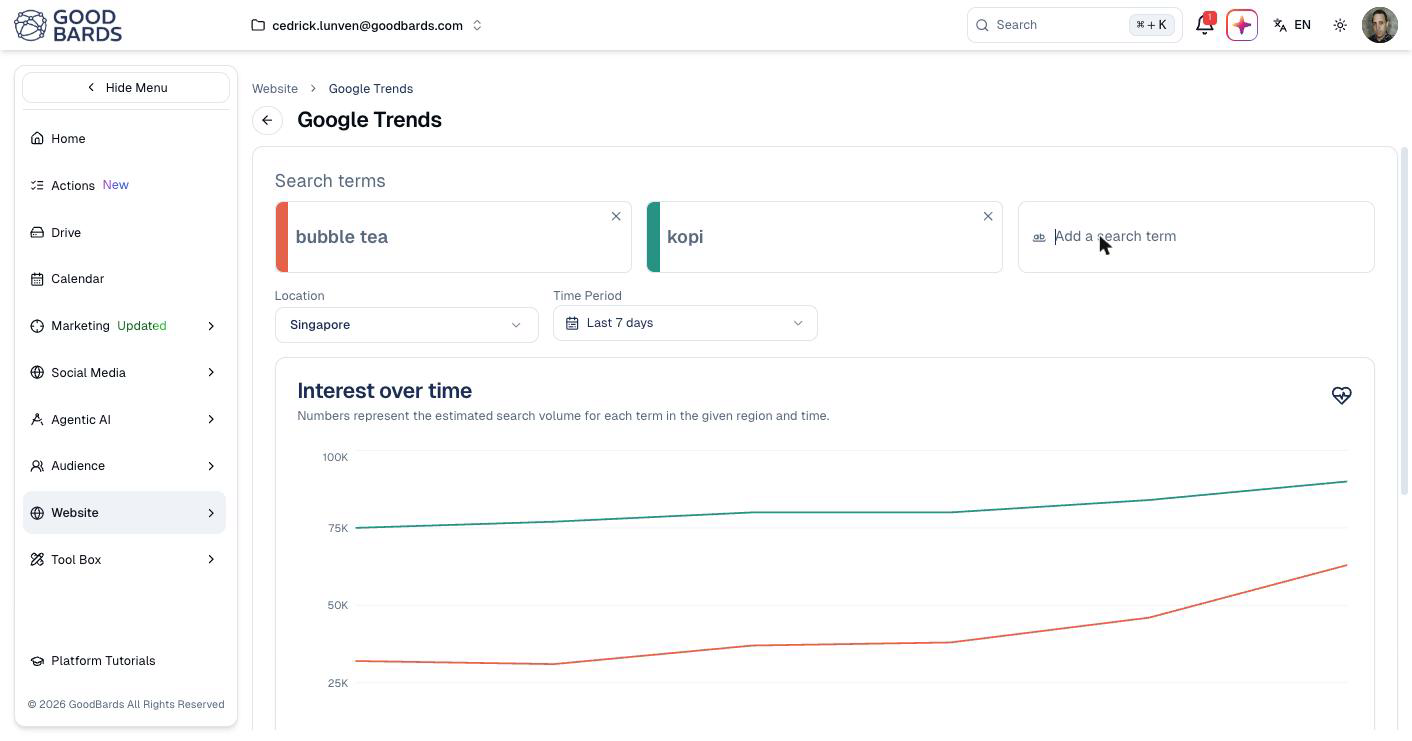
Each term gets its own colour, matching its line on the chart. Remove one with the × on its card.
Reading the chart
Interest over time plots each term across the period. Hover any point to see the figures for that day.
One term and two terms are measured differently
With a single term, the numbers are relative: 100 is that term's own peak for the period, not an absolute count. Add a second term and the chart shows estimated search volume instead, which is what makes comparison meaningful.
The shape matters more than the numbers. A line climbing steadily is a topic worth being early on; a sharp spike that falls away is a moment that has passed.
Breakdown by location
Below the chart, Breakdown by location shows where your terms were most popular, sorted by whichever term you choose.
No sub-region data for Singapore
Google does not provide a sub-region breakdown for every location. For Singapore it returns nothing, and the section tells you to pick another location or Worldwide. This is a limit of Google's data, not a fault in GoodBards.
Choosing a location
Location sets the market you are looking at, and it changes the answer completely. A term that is rising in Singapore may be flat in Indonesia.
Check each market separately
If you market across Southeast Asia, set each country in turn rather than assuming one stands for the others.
Good to know
- Compare like with like. Two terms on one chart is more useful than one term in isolation, because it gives you a sense of scale.
- Interest is not intent. People searching a term are not necessarily ready to buy: pair this with your own analytics.
- Watch for seasonality. Widen the time period before concluding a rise is new; it may be the same peak that happens every year.
- Recent days may be incomplete. Google's most recent figures are still settling, so treat the last point on the chart with caution.
Still stuck? Contact support.